
Audit the evidence
Download the claim-level research
These files expose all 45 verdicts, the 60-source ledger, and the definitions behind the official data-series audit.
Executive summary
The viral “What happened in 1971?” thesis combines four distinct propositions. The first is historical: Nixon ended official dollar-gold convertibility. That is correct, with a crucial qualification—ordinary Americans had already lost general domestic gold redemption in the 1930s. The channel closed in 1971 chiefly served foreign monetary authorities.
The second proposition is chronological: many indicators allegedly changed direction in 1971. This is partly correct only at the broadest level. Inflation accelerated before 1971. Productivity growth slowed around 1973. Federal debt relative to GDP did not surge immediately. Manufacturing employment continued increasing until 1979. Several popular median-earnings, housing, tuition, or inequality series begin too late to identify a 1971 break or require splicing data with different definitions.
The third proposition is causal: closing the gold window allegedly produced the later outcomes. A causal case is strongest where the mechanism is close. The 1971–1973 transition directly changed official convertibility, exchange-rate architecture, reserve policy, and gold’s monetary pricing environment. It plausibly contributed to exchange-rate movements, import prices, and inflation expectations. The case weakens as the outcome moves farther away. Housing depends on income, population, credit, rates, construction, zoning, and local supply. Healthcare depends on prices, utilization, insurance, programs, technology, demographics, and provider organization. Incarceration depends directly on criminal law, sentencing, policing, and drug policy. Monetary conditions can interact with these systems, but interaction is not proof of one origin.
The fourth proposition is counterfactual: the unwanted outcomes would not have occurred under continued gold convertibility. That claim is rarely specified. A serious counterfactual must state the parity, redemption holders, reserve rules, bank treatment, response to reserve losses, and the monetary or fiscal adjustments needed to preserve the promise.
This research audits forty-five recurring claims. Gold pricing receives the strongest direct classification. Inflation and exchange-rate effects are plausible contributors rather than sole causes. Most universal claims fail because the premise is wrong, the data do not identify 1971, or chronology substitutes for a mechanism.
Key findings
- 1971 ended official international dollar-gold convertibility, not ordinary domestic redemption.
- Fixed exchange rates did not disappear on August 15. The Smithsonian Agreement attempted a repair; generalized floating followed in 1973.
- The Great Inflation predated the Nixon shock.
- Official productivity analysis commonly uses 1973, not 1971.
- Wages and compensation are not interchangeable. Benefits, coverage, mean/median, hours, and deflators change comparisons.
- Labor’s share did not suffer one universal 1971 collapse.
- Federal debt did not explode immediately. Debt held by the public fell to 23 percent of GDP in 1974.
- Manufacturing employment peaked in June 1979.
- Several viral series cannot identify a 1971 breakpoint because they start too late or lack a useful pre-period.
- Housing affordability is not one national price line.
- House prices and rents answer different questions.
- Healthcare and tuition have sector-specific institutional histories.
- Gold’s private price has a direct relationship to the monetary transition.
- The 1973 oil shock had independent geopolitical and supply causes.
- Income inequality is real, but a vertical line does not establish its causes.
- Women’s labor-force participation rose across decades and peaked in 1999.
- Incarceration expanded much more rapidly in the 1980s.
- A gold-standard counterfactual is not a frozen version of 1970.
- A chart can be numerically correct and causally misleading.
- Reproducibility is the strongest corrective: source, definition, transformation, retrieval date, code, and uncertainty.
Four questions hidden inside “What happened in 1971?”
What changed in the monetary system?
Nixon suspended official dollar-gold conversion, announced a wage-price freeze, imposed an import surcharge, and proposed tax measures. The Smithsonian Agreement changed parities without reopening the gold window. (State Department)
When did each series change?
Inflation, productivity, pay, debt, housing, saving, manufacturing, and incarceration are measured with different units and histories. There is no reason to presume they share a breakpoint before examining the data.
Did the monetary change cause the series to change?
A causal claim needs mechanism, timing, magnitude, sensitivity tests, comparison groups, and a counterfactual. Gold and exchange-rate claims are institutionally close. Claims about medical technology, zoning, sentencing, or marriage require many additional steps.
Would the trend have been different under continued convertibility?
Continued convertibility would have required tighter policy, fiscal adjustment, devaluation, controls, reserve restrictions, international cooperation, or recessionary adjustment. “Keep gold” is not a complete policy model.
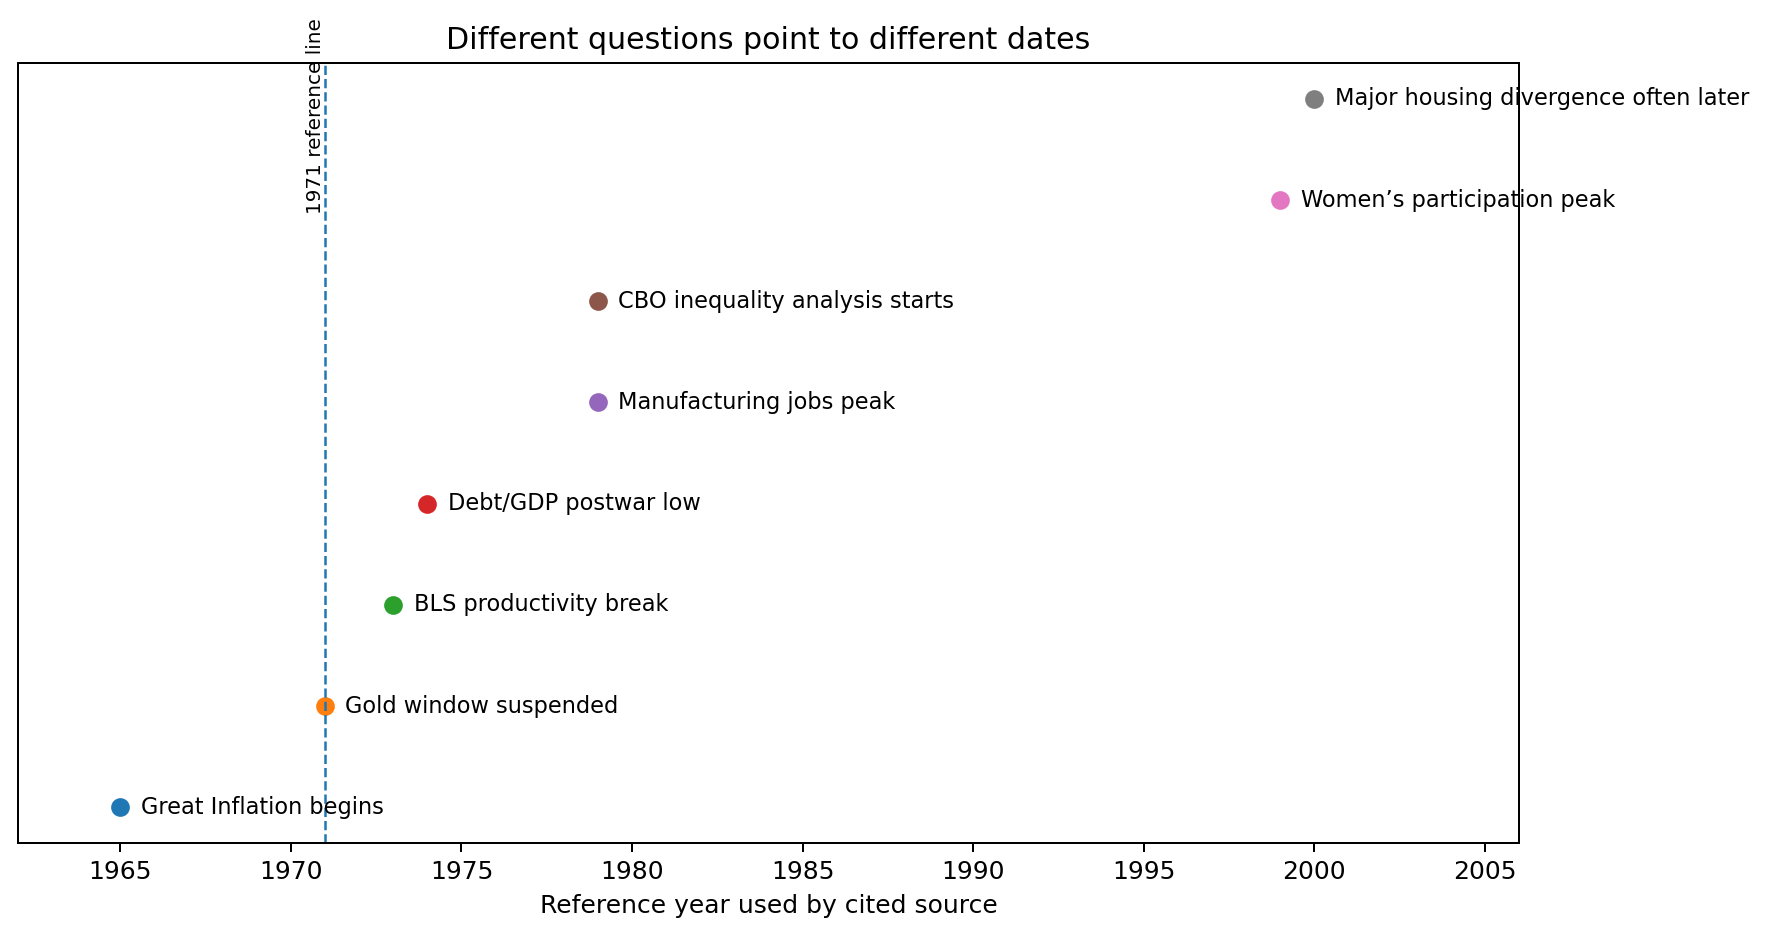
Figure 2. Different questions point to different dates. The years describe official reference points, not a causal chain.
What happened on August 15, 1971?
Nixon’s announcement was a policy package, not a solitary gold decree. It included suspension of official conversion, a ninety-day wage-and-price freeze, a temporary ten-percent import surcharge, and tax or investment proposals. The administration faced rising inflation, pressure against the dollar, foreign dollar claims, and doubts about the $35 parity. The dollar’s reserve role created a structural tension: the world demanded dollar liquidity, but expanding dollar claims made the fixed gold promise less credible. (Federal Reserve History)
What the gold window was
The gold window was not a public counter where any American could exchange a banknote for bullion. Ordinary domestic redemption had already been dismantled. Under Bretton Woods, the United States preserved an official conversion relationship for foreign monetary authorities. That distinction is why both 1933 and 1971 matter in the history of the U.S. departure from gold.
What did not happen that night
The announcement did not invent fiat money, terminate every fixed exchange rate immediately, erase constraints on public spending, eliminate U.S. gold holdings, create the first inflation in American history, or establish oil redemption. See what fiat currency means, what backs the dollar, and how money is created.
Why 1973 matters as much as 1971
Governments tried to save fixed rates without restoring gold conversion. The December 1971 Smithsonian Agreement realigned currencies and widened bands. It lasted about fifteen months. Renewed pressure brought another dollar devaluation, and major currencies moved toward floating in March 1973. (Federal Reserve History)
A series that changes in 1972, 1973, or 1974 may reflect exchange-rate transition, controls, their removal, oil shocks, recession, or several of these. Calling the whole cluster “1971” compresses different mechanisms.
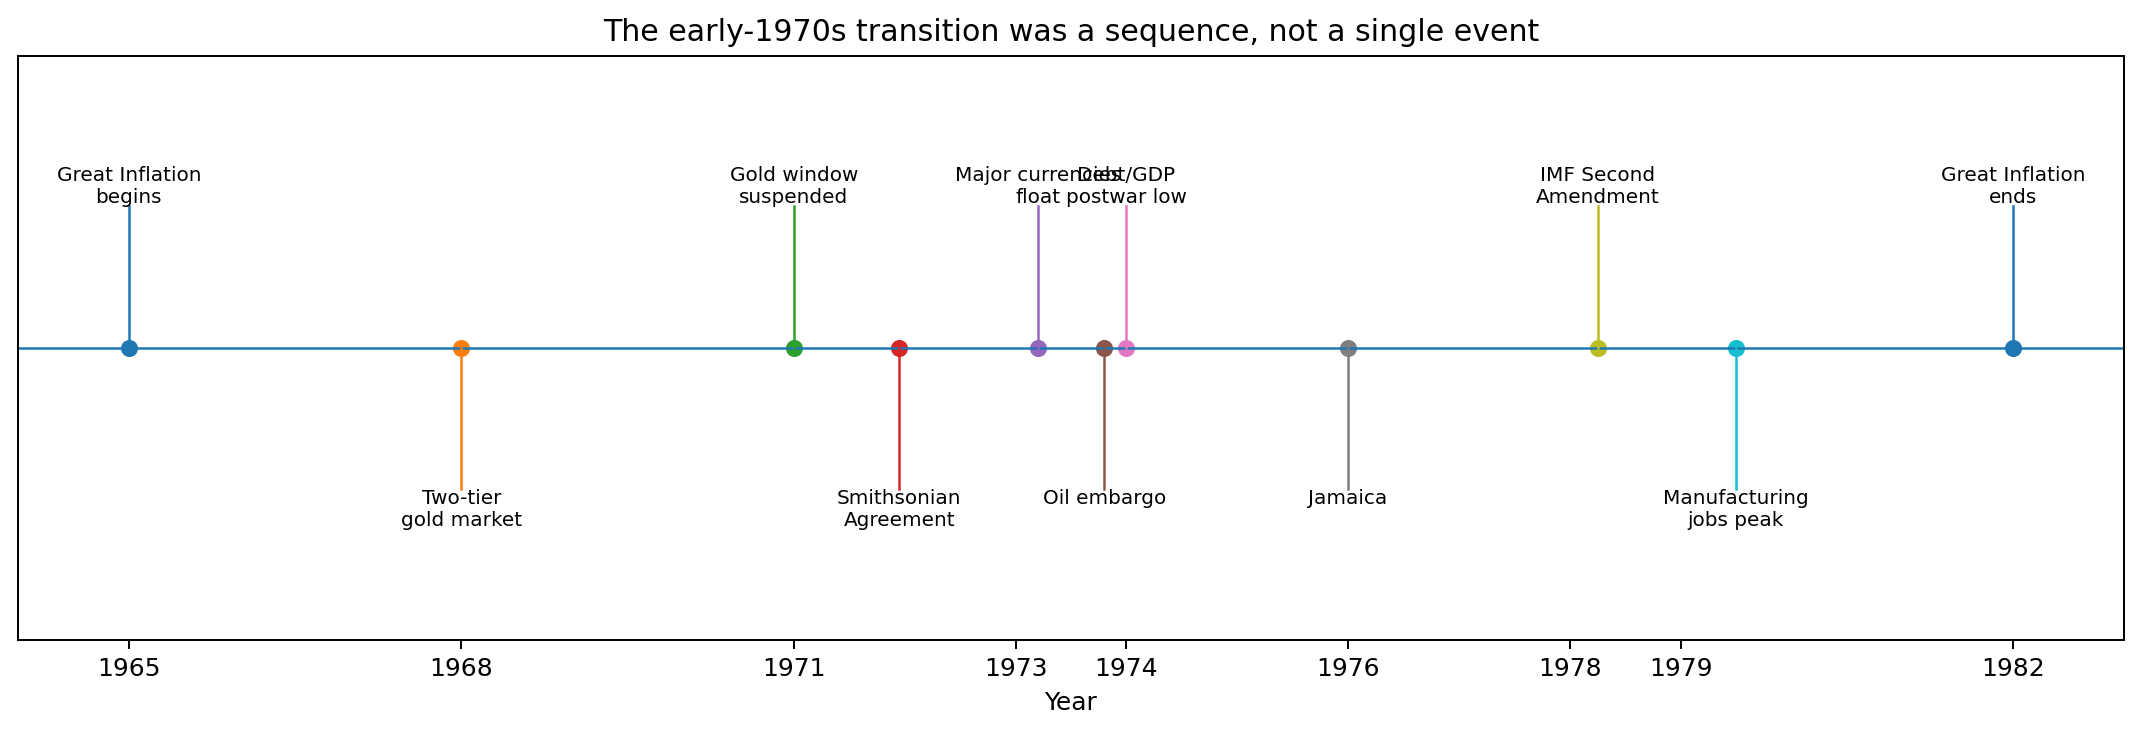
Concise chronology
| Date | Event | Analytical significance |
|---|---|---|
| 1965 | Great Inflation period begins in Federal Reserve History | Inflation was rising before the gold-window suspension |
| March 1968 | London Gold Pool collapsed; two-tier gold market | Official and private gold markets were already separating |
| August 15, 1971 | New Economic Policy announced | Gold-window suspension, controls, import surcharge, tax measures |
| December 1971 | Smithsonian Agreement | Fixed-rate repair without restored gold conversion |
| March 1973 | Major currencies moved toward floating | Operational end of fixed parities among major currencies |
| October 1973–March 1974 | Oil embargo and production cuts | Independent supply and geopolitical shock layered onto inflation |
| 1974 | Debt held by public reached 23% of GDP | Contradicts an immediate debt explosion |
| January 1976 | Jamaica agreement | International reform of exchange and gold arrangements |
| April 1978 | IMF Second Amendment took effect | Legal consolidation of the post-Bretton Woods order |
| June 1979 | Manufacturing employment reached its all-time peak | Contradicts a continuous 1971 collapse |
| 1979–1982 | Volcker disinflation and recessions | End phase of the Great Inflation |
How to audit a “1971” chart
- Identify the original source. A reposted image is not a dataset.
- Define the metric. Wage, compensation, income, wealth, and consumption differ.
- Control nominal and real values. Nominal values combine price and real change.
- Name the deflator. CPI, PCE, GDP prices, and output deflators answer different questions.
- Align populations. Sector-wide productivity should not be compared casually with a narrow worker group.
- Distinguish mean and median. They describe different parts of a distribution.
- Treat benefits deliberately. Total compensation and cash wages are different.
- Check coverage. A series starting in 1975 or 1979 cannot identify a 1971 break unaided.
- Inspect the full range. A break can disappear when the chart starts earlier or ends later.
- Test candidate dates. A vertical line is not a breakpoint estimate.
- State the mechanism. “Fiat money” is not a mechanism for zoning, medical utilization, or sentencing.
- Respect lags. An effect that predates the policy cannot ordinarily be caused by it.
- Use comparison groups. Shared global trends weaken a single-country causal story.
- Test alternatives. Oil, demographics, technology, taxes, regulation, unions, trade, and policy matter.
- Publish uncertainty. “Mixed” and “data insufficient” are valid verdicts.
Verdict taxonomy
| Verdict | Meaning |
|---|---|
| Strong direct institutional relationship | The outcome is part of the monetary arrangement or has an immediate documented channel |
| Plausible contributing relationship | A defensible channel exists, but it is not sufficient alone |
| Mixed/indirect | The link has multiple steps and strong alternatives |
| Chronological coincidence | Timing is visible but mechanism and counterfactual are absent |
| Data insufficient / series mismatch | The series cannot identify the claim or compares incompatible concepts |
| Unsupported direct claim | The direct statement is stronger than the evidence |
| False factual premise | The claim begins from incorrect history or measurement |
Master claim-audit matrix
The verdict applies to the direct claim. Rejecting a sole-cause statement does not mean monetary conditions were irrelevant. The downloadable CSV contains the complete rationale.
| ID | Domain | Claim | Verdict | Confidence | Sources |
|---|---|---|---|---|---|
| C001 | Monetary history | Every U.S. dollar was fully backed by an equal value of gold until August 1971. | False factual premise | High | S001, S002 |
| C002 | Monetary history | Ordinary Americans could redeem dollars for Treasury gold immediately before Nixon’s announcement. | False factual premise | High | S001, S002 |
| C003 | Monetary history | Fiat money was invented in 1971. | False factual premise | High | S001, S002 |
| C004 | Exchange rates | Major currencies began floating freely on August 15, 1971. | False factual premise | High | S001, S003 |
| C005 | Monetary history | 1971 was economically irrelevant because domestic gold redemption had already ended. | Unsupported direct claim | High | S001, S002, S003 |
| C006 | Inflation | The Great Inflation began when Nixon closed the gold window. | False factual premise | High | S004 |
| C007 | Inflation | Ending gold convertibility single-handedly caused 1970s inflation. | Plausible contributing relationship | High | S002, S004, S005 |
| C008 | Energy | Oil shocks were merely consequences of fiat money. | Unsupported direct claim | High | S005, S006 |
| C009 | Productivity and pay | Productivity and compensation separated precisely in 1971. | Unsupported direct claim | High | S007, S008, S011 |
| C010 | Productivity and pay | Workers received none of the gains from productivity after 1971. | False factual premise | High | S007, S011 |
| C011 | Methodology | Any productivity series can be validly compared with any wage series. | False factual premise | High | S008, S011 |
| C012 | Labor share | Labor’s share collapsed immediately after 1971. | Unsupported direct claim | High | S008, S012 |
| C013 | Wages | Median wages froze permanently in 1971. | Data insufficient / series mismatch | High | S011, S047 |
| C014 | Household income | Median household income is interchangeable with one worker’s wage. | False factual premise | High | S013, S015, S056 |
| C015 | Inequality | Income inequality began in 1971. | Unsupported direct claim | High | S013, S014, S015 |
| C016 | Inequality | A rising top-income share proves the gold-window closure was the cause. | Chronological coincidence | High | S013, S014 |
| C017 | Housing | Housing became unaffordable immediately because the dollar became fiat. | Unsupported direct claim | High | S019, S020, S021, S022, S023 |
| C018 | Housing methodology | A house-price series beginning in the mid-1970s can prove a 1971 discontinuity. | Data insufficient / series mismatch | High | S019, S043 |
| C019 | Housing methodology | Rent and house prices measure the same thing. | False factual premise | High | S019, S044 |
| C020 | Healthcare | Healthcare costs rose because gold backing ended. | Unsupported direct claim | High | S025, S045 |
| C021 | Education | College tuition rose because governments could print money after 1971. | Unsupported direct claim | High | S024, S046 |
| C022 | Education and credit | Student debt is a mechanical consequence of closing the gold window. | Unsupported direct claim | High | S024 |
| C023 | Fiscal history | Federal debt could not grow under a gold standard. | False factual premise | High | S016, S017 |
| C024 | Fiscal history | Federal debt exploded immediately after 1971. | False factual premise | High | S016, S017 |
| C025 | Fiscal capacity | Fiat currency lets government spend without economic constraints. | False factual premise | High | S016, S018 |
| C026 | Trade | Trade deficits and offshoring began because of the 1971 decision alone. | Unsupported direct claim | Medium-high | S001, S027, S028 |
| C027 | Employment | Manufacturing employment began a continuous collapse in 1971. | False factual premise | High | S027, S028 |
| C028 | Employment methodology | Manufacturing output and manufacturing employment are interchangeable. | False factual premise | High | S009, S027 |
| C029 | Saving | The personal saving rate collapsed immediately after 1971. | Unsupported direct claim | Medium-high | S026, S034, S039 |
| C030 | Saving methodology | A lower measured saving rate means households accumulated no assets. | False factual premise | High | S026, S034 |
| C031 | Household finance | Household debt rose only because money was no longer redeemable for gold. | Unsupported direct claim | High | S023, S026 |
| C032 | Asset prices | Stock gains after 1971 prove debasement caused all asset appreciation. | Unsupported direct claim | High | S004, S023 |
| C033 | Gold | The private gold price had no special relationship to the 1971–1973 transition. | Strong direct institutional relationship | High | S002, S003, S042 |
| C034 | Oil and dollar | Oil became the contractual backing for the dollar after 1971. | False factual premise | High | S001, S005, S006 |
| C035 | Crime | Crime rose because the dollar became fiat. | Unsupported direct claim | High | S031 |
| C036 | Incarceration | Mass incarceration was an immediate consequence of 1971. | Unsupported direct claim | High | S029, S030, S059 |
| C037 | Labor and gender | Women entered paid work primarily because fiat money destroyed one-income households. | Unsupported direct claim | High | S032, S033, S048 |
| C038 | Household structure | Dual-income households prove real living standards fell after 1971. | Unsupported direct claim | High | S032, S033 |
| C039 | Family demography | Divorce and fertility trends can be assigned to 1971 from timing alone. | Chronological coincidence | High | S032, S033 |
| C040 | Methodology | If many charts bend near one date, they must share one cause. | False factual premise | High | S004, S005, S051 |
| C041 | Methodology | A vertical line at 1971 is a statistical breakpoint test. | False factual premise | High | S009, S051 |
| C042 | Methodology | Choosing 1971 after seeing a chart does not affect inference. | False factual premise | High | S051 |
| C043 | Methodology | Nominal and inflation-adjusted series can be compared without qualification. | False factual premise | High | S008, S038 |
| C044 | Methodology | Mean and median income tell the same distributional story. | False factual premise | High | S013, S015 |
| C045 | Synthesis | The only choices are “1971 caused everything” or “1971 caused nothing.” | Mixed/indirect | High | S001, S002, S003, S004 |
Productivity, wages, and compensation
The productivity-pay charts address a genuine postwar change and are among the easiest to misconstruct. BLS reports similar robust growth in nonfarm-business productivity and real hourly compensation from 1947 through 1973. Both slowed after 1973, and the gap widened in later periods. The official dividing point is therefore commonly 1973, not August 1971. (BLS)
That does not settle distribution. Average total compensation can remain linked to average productivity while median compensation lags. Stansbury and Summers emphasize that median compensation diverged sharply from average productivity after 1973 and that average compensation weakened relative to productivity after 2000. They treat the link as weakened, not nonexistent. (NBER)
A defensible chart must state sector, worker group, wages versus compensation, benefits, mean versus median, hours, and deflator. BLS decomposes the gap into labor-share change and differences between output and consumer prices. From 1973 to 1990, the deflator difference accounts for much of the selected gap; after 2000, falling labor share contributes more. (BLS)
The evidence supports a substantive distributional problem. It does not support the claim that one monetary announcement mechanically froze every worker’s pay.
Labor share and inequality
Labor share is the portion of measured output accruing to labor compensation. It is not median wages. A stable aggregate share can coexist with unequal wage distribution, and a falling share can affect average compensation even when median inequality changes for other reasons.
BLS finds movement across several periods rather than one clean 1971 collapse. The labor share’s contribution to the productivity-compensation gap is especially pronounced after 2000. (BLS)
Income inequality increased substantially later in the twentieth century. CBO’s principal analysis begins in 1979 and tracks taxes, transfers, capital gains, and household income through 2021. (CBO) A causal account must examine tax policy, executive compensation, unionization, technology, globalization, education, market power, household structure, and capital ownership. A shared date is not enough.
Median wages and household income
A household is not a worker. Household income changes with earners, hours, transfers, pensions, capital income, demographic composition, and household formation. Median wage series also often begin later than productivity data. The BLS median weekly real earnings series commonly used through FRED begins in 1979, so it cannot independently identify a 1971 break. (FRED/BLS)
The audit therefore classifies “median wages froze in 1971” as a series-mismatch claim unless a publisher supplies a transparent longer series and reconciles definitions.
Inflation
Inflation is one area where the transition has a plausible contributing channel. Suspending conversion reduced one external constraint, changed exchange expectations, and preceded dollar depreciation. Those developments could affect imports and expectations.
But inflation was already rising. Federal Reserve History defines the Great Inflation as 1965–1982. Accommodative policy, fiscal demand, controls, unstable expectations, productivity, and oil shocks all mattered. (Federal Reserve History)
The correct verdict is neither “1971 had no effect” nor “1971 alone caused inflation.” It was one part of an inflation process that had begun earlier.
Housing prices, rents, and affordability
Housing claims often combine three different series: prices, rents, and affordability. They should be separated. The FHFA HPI begins in the mid-1970s, leaving little pre-1971 history for a formal test. (FHFA)
Affordability depends on price, income, mortgage rates, down payment, taxes, insurance, household type, and location. Federal Reserve research identifies population, income, local supply, regulation, geography, and financing as relevant. Current scholarship disagrees over how much supply constraints versus demand explain recent differences; that disagreement should be preserved. (San Francisco Fed; Federal Reserve Board)
Rent prices housing services. Home-sale prices also capitalize land, finance, expected appreciation, and asset demand. A chart using house prices to represent “shelter cost” should disclose that distinction.
Healthcare
Healthcare is resistant to one-variable explanations. CMS accounts divide spending by service, payer, and sponsor. “Healthcare cost” can mean hospital prices, physician services, drugs, administration, public programs, utilization, or out-of-pocket payments. (CMS)
A monetary channel can influence general inflation and financing. It does not directly explain medical innovation, insurance design, provider consolidation, Medicare and Medicaid, demographics, or utilization. The direct 1971 claim is unsupported.
College tuition and student debt
NCES publishes tuition, fees, room, and board in current and constant dollars from 1963–64 onward. Any chart should identify category, institution type, and price basis. (NCES)
Tuition reflects appropriations, enrollment, aid, institutional spending, labor intensity, amenities, and market segmentation. Student debt adds lending rules, limits, family resources, and expected returns. The fact that these systems use dollars does not establish nonconvertibility as their cause.
Federal debt and deficits
The debt claim provides a clear factual test. CBO reports debt held by the public fell from 106 percent of GDP in 1946 to 23 percent in 1974. It rose only slightly by 1980 despite nominal debt growth. (CBO)
That history contradicts an immediate debt-ratio explosion after 1971. Later growth must be assigned to specific deficits, wars, recessions, tax decisions, programs, interest costs, and crises. Gold convertibility also never prohibited government borrowing; it altered adjustment choices.
Trade and manufacturing
Exchange rates affect trade but are not the only influence. Foreign recovery, energy imports, relative productivity, trade policy, transport, demand, and global production matter.
Manufacturing employment offers a decisive date check. BLS reports an all-time peak of about 19.6 million jobs in June 1979. (BLS) A chart can still show that manufacturing’s share declined earlier, but “share,” “jobs,” and “output” are different propositions.
Saving and household debt
BEA defines the personal saving rate as saving divided by disposable personal income and revises historical estimates. It is not a direct measure of net-worth accumulation because unrealized capital gains are excluded from NIPA income. (BEA)
Saving depends on income, wealth, demographics, pensions, credit, taxes, rates, and measurement. Household debt also has balance-sheet counterparts. Evaluating welfare requires assets, income, interest burden, default risk, and distribution—not debt alone.
Stocks and asset prices
Nominal asset values respond to inflation, earnings, discount rates, risk premiums, taxes, retirement saving, market structure, and globalization. A gold-window change can affect rates and expectations, but “debasement” does not identify which component dominates. Responsible charts separate nominal return, real return, dividends, and valuation multiples.
Gold
Gold is the strongest direct case. The 1971–1973 transition dismantled the official conversion and fixed-parity system in which gold had a formal role. Private gold prices could respond to inflation expectations, exchange pressure, reserve behavior, and market demand. (Federal Reserve History; FRED gold series)
Not every gold increase has one cause. The point is causal proximity: the rule governing dollar-gold conversion itself changed.
Oil pricing after 1971
The 1973–74 oil shock involved war, embargo, production cuts, and producer pricing decisions. Federal Reserve History reports a near-fourfold price increase from before the embargo to January 1974. (Federal Reserve History)
Dollar depreciation affected nominal pricing, but oil did not become an asset into which dollars were contractually redeemable. “Petrodollar” describes invoicing, reserves, and recycling—not commodity backing. The petrodollar document audit follows the distinct 1972 pricing record, 1974 commission, 1975 technical agreement, and 2024 expiration claim.
Crime and incarceration
Crime statistics require offense, reporting, demographic, policing, and local controls. A single crime index cannot be assigned to the monetary regime without a mechanism. (FBI)
Prison populations have a direct policy history. BJS reported a rising trend by 1980 and a 134 percent increase in inmates between 1980 and 1990. Sentencing, drug enforcement, parole, admissions, and capacity are direct mechanisms. (BJS 1980; BJS 1990)
Economic conditions can affect crime and punishment. The audit rejects the shortcut from a monetary date to incarceration without the institutional history.
Women’s paid work, marriage, and fertility
BLS reports that women’s participation increased dramatically from the 1960s through the 1980s, slowed in the 1990s, and peaked at 60 percent in 1999. (BLS)
Household economics mattered, but so did education, legal rights, occupational access, contraception, technology, norms, and preferences. Treating women’s employment only as currency deterioration erases expanded choice and nonmonetary causal evidence.
Marriage and fertility charts require cohort, age-specific, legal, and demographic controls. Aggregate timing alone cannot identify gold convertibility as the cause.
What 1971 plausibly changed
The strongest pathways were official reserve behavior, exchange-rate expectations, gold pricing, import prices, monetary-policy autonomy, inflation expectations, and international adjustment. These were substantial consequences. They do not supply a universal key for every later trend.
What did not disappear
Fiat currency did not eliminate resource scarcity, inflation constraints, interest costs, exchange pressure, bank solvency, legal authorization, taxation, productive capacity, distributional conflict, or international confidence. Operational monetary capacity is not economic omnipotence.
The missing counterfactual
The strongest viral thesis must show outcomes would have been better under continued convertibility. That counterfactual needs a parity, redemption rules, reserve adequacy, bank-deposit treatment, response to reserve losses, monetary/fiscal adjustment, controls, devaluation rules, and lender-of-last-resort policy. A government can defend a parity by raising rates, cutting demand, imposing controls, borrowing reserves, devaluing, or suspending conversion. Each choice has consequences.
Myth versus evidence
- Every dollar was fully backed until 1971. Bretton Woods was layered and fractional.
- Nixon made the dollar fiat overnight. Domestic nonconvertibility long predated him.
- Floating began that night. The Smithsonian repair lasted until 1973.
- Inflation began in 1971. The Great Inflation began by the mid-1960s.
- Gold’s end was the only inflation cause. Policy, expectations, controls, oil, and productivity also mattered.
- Productivity and pay separated precisely in 1971. BLS commonly uses 1973.
- Workers received no gains afterward. Compensation grew, but more slowly and unevenly.
- Labor share collapsed once after the gold window. The periods and causes differ.
- Household income is a wage series. It combines earners and nonwage income.
- Inequality began in 1971. Official analyses emphasize later periods and multiple mechanisms.
- Housing proves fiat causation. Affordability combines prices, income, rates, supply, and location.
- Healthcare and tuition rose because money was unbacked. Each has a specific institutional history.
- Debt could not grow under gold. Convertible-standard governments borrowed heavily.
- Debt exploded immediately after 1971. Debt held by the public reached a low in 1974.
- Manufacturing collapsed in 1971. Employment peaked in 1979.
- Oil replaced gold backing. Invoicing is not redemption.
- Crime and incarceration are monetary indicators. Criminal-justice policy supplies direct mechanisms.
- Women worked only because one income became impossible. Education, law, rights, and preferences mattered.
- Many correlated charts prove one cause. Common timing is not causal identification.
- Rejecting universal causation means 1971 did not matter. It mattered directly for gold, reserves, and exchange rates.
Quick reference
Frequently asked questions
Short answers to the most common claims about gold, inflation, wages, debt, housing, oil, and the viral 1971 charts.
What happened to the dollar in 1971?
Nixon suspended official conversion of foreign monetary-authority dollars into gold and announced controls, a surcharge, and tax measures.
Did the dollar become fiat on August 15?
It became more completely nonconvertible internationally, but domestic holders had already lost general gold redemption. Fiat systems also existed much earlier.
Could Americans redeem dollars for gold before the announcement?
Not through a general domestic Treasury right. The surviving window was an official international arrangement.
Did Bretton Woods end immediately?
The gold-conversion core was suspended, but revised fixed rates were attempted until 1973.
Why is 1973 important?
It marks the failure of the fixed-rate repair and is the BLS dividing point in much productivity analysis.
Did inflation start in 1971?
No. It was underway by the mid-1960s.
Did ending gold contribute to inflation?
Plausibly, through exchange rates, imports, expectations, and policy autonomy—but not as the sole cause.
Did productivity and wages separate in 1971?
No unique break is established. BLS often uses 1973, and results depend on measure and deflator.
Why do viral charts use 1971?
The date is memorable and monetarily important. It can also be selected after inspecting the data.
Did labor’s share collapse after 1971?
It changed across periods, with a particularly large contribution to the gap after 2000.
Did inequality begin in 1971?
No single start date is established. CBO’s core long-run analysis begins in 1979.
Did fiat money cause housing prices?
Monetary and credit conditions affect housing, but supply, land, population, income, taxes, construction, and rates also matter.
Did fiat money cause healthcare costs?
No direct one-cause relationship is demonstrated.
Did tuition rise because government could print?
The evidence does not establish that mechanism; appropriations, aid, enrollment, and institutional costs matter.
Did debt begin exploding in 1971?
No. Debt held by the public reached a postwar low relative to GDP in 1974.
Did gold prevent government debt?
No. Governments borrowed under gold standards.
Did manufacturing decline start in 1971?
Manufacturing employment peaked in 1979.
Did saving collapse in 1971?
BEA data show longer and revised trends influenced by many factors.
Did gold prices rise because of the regime change?
The relationship is direct, although inflation, uncertainty, and market demand also mattered.
Did oil become the dollar’s backing?
No. Oil trade supported dollar demand but did not create redemption. See the petrodollar evidence guide for the agreement and recycling record.
Did Vietnam cause the decision?
Overseas spending contributed, but Bretton Woods also had a structural liquidity-confidence problem.
Did crime rise because of fiat currency?
No direct case is established.
Did mass incarceration begin in 1971?
The trend rose around the 1970s but accelerated dramatically in the 1980s under criminal-justice policy changes.
Did women work because the dollar lost value?
Household economics mattered, alongside education, law, rights, fertility control, norms, and choice.
Are all viral charts wrong?
No. Some show real data. The usual failure is the common-cause inference.
How can a chart be checked?
Demand the source, identifier, units, deflator, population, range, transformations, and code.
What is the strongest direct consequence?
The end of official dollar-gold conversion and transformation of exchange-rate architecture.
What is the strongest chart relationship?
Gold’s price is unusually close to the institutional change.
Could the gold window have stayed open?
Only with other adjustments—tighter policy, fiscal change, controls, devaluation, or new international arrangements.
Does this audit defend fiat currency?
No. It separates documented effects from claims that are incorrectly dated, defined, or causal.
Does it reject a gold standard?
No. It requires the alternative to specify parity, redemption, reserves, bank treatment, and crisis policy.
What should a revised chart collection publish?
Source URLs, downloadable data, definitions, retrieval dates, transformations, code, sensitivity tests, and causal confidence.
Reproducibility protocol
This package includes a forty-five-row claim audit, a fifteen-series data dictionary, a source ledger, and a Python script that downloads current FRED mirrors and estimates candidate breaks. The script annualizes high-frequency series, compares piecewise-linear models, and reports diagnostics for 1971 and 1973. A statistical break is not causal proof.
Economic series are revised, so this article does not hard-code one permanent breakpoint from one vintage. Run the script immediately before publication, archive the retrieved files, and disclose the retrieval date and software environment.
Every chart should state source, identifier, retrieval date, frequency, annualization, units, deflator, splice, candidate-break method, sensitivity, and revisions.
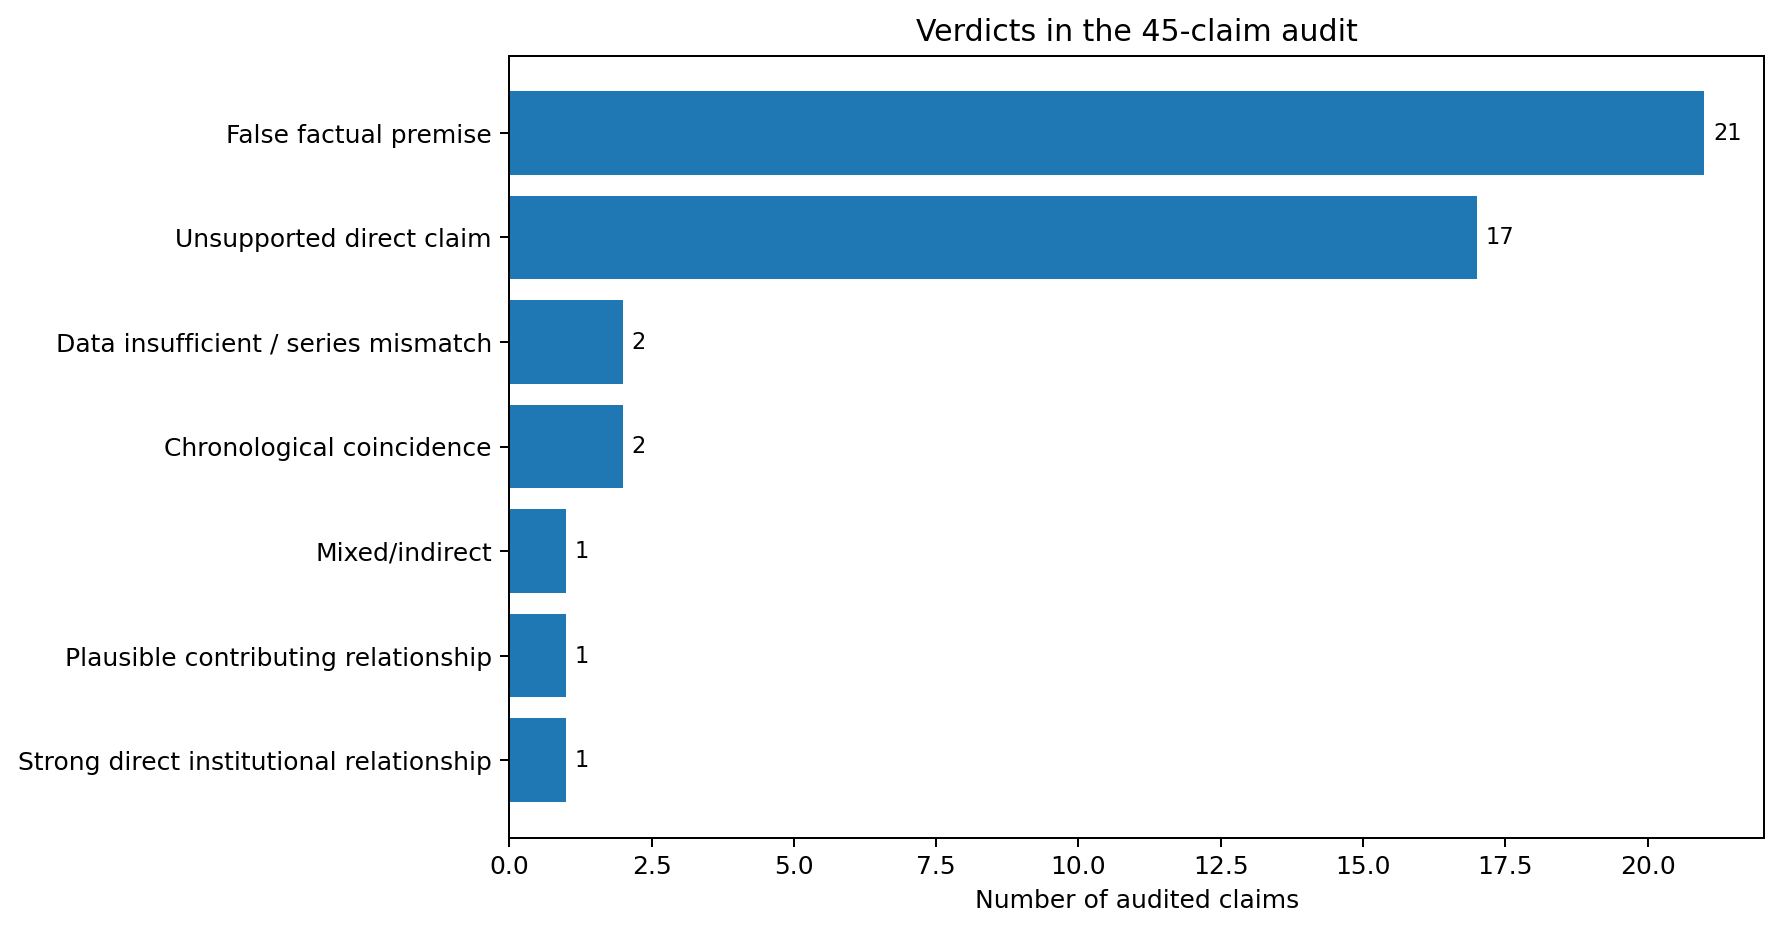
Figure 3. Verdict distribution in the claim audit. The count concerns the wording of the direct claim, not whether monetary conditions had any indirect role.
Conclusion
“What happened in 1971?” is useful as the beginning of an investigation, not as its answer.
The gold window closed. The fixed-rate repair failed. Gold, exchange rates, official reserves, and monetary-policy autonomy changed directly. Inflation was already rising and continued through policy, expectations, and supply shocks. Those facts make the date important.
They do not explain every line placed beside it. Productivity analysis points to 1973 and requires compensation and deflator controls. Debt relative to GDP reached a low in 1974. Manufacturing jobs peaked in 1979. Inequality, incarceration, women’s employment, healthcare, tuition, and housing each have their own institutions and chronologies. Some series cannot observe enough years before 1971 to test the claim.
The most accurate synthesis is conditional: direct for gold conversion and exchange architecture; plausible contributor for imports and inflation expectations; multicausal for productivity distribution, inequality, debt, housing, saving, trade, and assets; unsupported as a direct one-date explanation for healthcare, tuition, crime, incarceration, and family change.
A serious history of fiat currency need not minimize the break with gold. It must describe that break precisely enough that it is not asked to explain everything else.
Sources and bibliography
- S001 — U.S. Department of State, Office of the Historian. “Nixon and the End of the Bretton Woods System, 1971–1973.” Official history. https://history.state.gov/milestones/1969-1976/nixon-shock
- S002 — Federal Reserve History. “Gold Convertibility Ends.” Institutional history. https://www.federalreservehistory.org/essays/gold-convertibility-ends
- S003 — Federal Reserve History. “The Smithsonian Agreement.” Institutional history. https://www.federalreservehistory.org/essays/smithsonian-agreement
- S004 — Federal Reserve History. “The Great Inflation.” Institutional history. https://www.federalreservehistory.org/essays/great-inflation
- S005 — Federal Reserve History. “Oil Shock of 1973–74.” Institutional history. https://www.federalreservehistory.org/essays/oil-shock-of-1973-74
- S006 — U.S. Department of State, Office of the Historian. “Oil Embargo, 1973–1974.” Official history. https://history.state.gov/milestones/1969-1976/oil-embargo
- S007 — U.S. Bureau of Labor Statistics. “The compensation–productivity gap.” Official statistical explanation. https://www.bls.gov/opub/ted/2011/ted_20110224.htm
- S008 — U.S. Bureau of Labor Statistics. “Estimating the U.S. labor share.” Institutional research. https://www.bls.gov/opub/mlr/2017/article/estimating-the-us-labor-share.htm
- S009 — U.S. Bureau of Labor Statistics. “Productivity program.” Official data portal. https://www.bls.gov/productivity/
- S010 — U.S. Bureau of Labor Statistics. “Below trend: the U.S. productivity slowdown.” Institutional research. https://www.bls.gov/opub/btn/volume-6/below-trend-the-us-productivity-slowdown-since-the-great-recession.htm
- S011 — Anna Stansbury and Lawrence H. Summers. “Productivity and Pay: Is the Link Broken?.” NBER working paper. https://www.nber.org/papers/w24165
- S012 — U.S. Bureau of Labor Statistics. “Labor share of output has declined since 1947.” Official statistical explanation. https://www.bls.gov/opub/ted/2017/labor-share-of-output-has-declined-since-1947.htm
- S013 — Congressional Budget Office. “Trends in the Distribution of Household Income From 1979 to 2021.” Official analysis. https://www.cbo.gov/publication/60342
- S014 — Congressional Budget Office. “Trends in Household Income Between 1979 and 2007.” Official analysis. https://www.cbo.gov/publication/42729
- S015 — U.S. Census Bureau. “Income Inequality Data Tables.” Official data portal. https://www.census.gov/topics/income-poverty/income-inequality/data/data-tables.html
- S016 — Congressional Budget Office. “Federal Debt: A Primer.” Official fiscal analysis. https://www.cbo.gov/publication/56309
- S017 — U.S. Treasury Fiscal Data. “Historical Debt Outstanding.” Primary data. https://fiscaldata.treasury.gov/datasets/historical-debt-outstanding/
- S018 — U.S. Treasury Fiscal Data. “Understanding the National Debt.” Official explainer. https://fiscaldata.treasury.gov/americas-finance-guide/national-debt/
- S019 — Federal Housing Finance Agency. “House Price Index.” Official data portal. https://www.fhfa.gov/data/hpi
- S020 — Federal Reserve Bank of San Francisco. “Housing Affordability and Housing Demand.” Central-bank research. https://www.frbsf.org/research-and-insights/publications/economic-letter/2026/02/housing-affordability-and-housing-demand/
- S021 — Federal Reserve Board. “Housing Supply and Affordability.” Central-bank research. https://www.federalreserve.gov/econres/feds/housing-supply-and-affordability.htm
- S022 — Federal Reserve Board. “Supply Constraints and Housing Market Dynamics.” Central-bank research. https://www.federalreserve.gov/econres/feds/supply-constraints-and-housing-market-dynamics.htm
- S023 — Federal Reserve Board. “House Prices and Monetary Policy: A Cross-Country Study.” Central-bank research. https://www.federalreserve.gov/pubs/ifdp/2005/841/ifdp841.htm
- S024 — National Center for Education Statistics. “Tuition, fees, room, and board, 1963–64 through 2022–23.” Official table. https://nces.ed.gov/programs/digest/d23/tables/dt23_330.10.asp
- S025 — Centers for Medicare & Medicaid Services. “National Health Expenditure Data.” Official data portal. https://www.cms.gov/data-research/statistics-trends-and-reports/national-health-expenditure-data
- S026 — U.S. Bureau of Economic Analysis. “Personal Saving Rate.” Official data portal. https://www.bea.gov/data/income-saving/personal-saving-rate
- S027 — U.S. Bureau of Labor Statistics. “Forty years of falling manufacturing employment.” Official analysis. https://www.bls.gov/opub/btn/volume-9/forty-years-of-falling-manufacturing-employment.htm
- S028 — U.S. Bureau of Labor Statistics. “100 years of employment, hours, and earnings.” Institutional history. https://www.bls.gov/opub/mlr/2016/article/current-employment-statistics-survey-100-years-of-employment-hours-and-earnings.htm
- S029 — Bureau of Justice Statistics. “Prisoners in 1980.” Official justice statistics. https://bjs.ojp.gov/library/publications/prisoners-1980-0
- S030 — Bureau of Justice Statistics. “Prisoners in 1990.” Official justice statistics. https://bjs.ojp.gov/library/publications/prisoners-1990-0
- S031 — Federal Bureau of Investigation. “Uniform Crime Reports publications.” Official data archive. https://www.fbi.gov/how-we-can-help-you/more-fbi-services-and-information/ucr/publications
- S032 — U.S. Bureau of Labor Statistics. “Women in the labor force.” Official statistical overview. https://www.bls.gov/cps/demographics/women-labor-force.htm
- S033 — U.S. Bureau of Labor Statistics. “Labor force participation since the peak.” Institutional research. https://www.bls.gov/opub/mlr/2016/article/labor-force-participation-what-has-happened-since-the-peak.htm
- S034 — U.S. Bureau of Economic Analysis. “Consumer spending and saving data.” Official data portal. https://www.bea.gov/data/consumer-spending/main
- S035 — FRED / BLS. “Labor Productivity (OPHNFB).” Official data mirror. https://fred.stlouisfed.org/series/OPHNFB
- S036 — FRED / BLS. “Real Hourly Compensation (COMPRNFB).” Official data mirror. https://fred.stlouisfed.org/series/COMPRNFB
- S037 — FRED / BLS. “Labor Share Index (PRS85006173).” Official data mirror. https://fred.stlouisfed.org/series/PRS85006173
- S038 — FRED / BLS. “Consumer Price Index (CPIAUCSL).” Official data mirror. https://fred.stlouisfed.org/series/CPIAUCSL
- S039 — FRED / BEA. “Personal Saving Rate (PSAVERT).” Official data mirror. https://fred.stlouisfed.org/series/PSAVERT
- S040 — FRED / BLS. “Manufacturing Employment (MANEMP).” Official data mirror. https://fred.stlouisfed.org/series/MANEMP
- S041 — FRED. “Federal Debt as Percent of GDP (GFDEGDQ188S).” Official data mirror. https://fred.stlouisfed.org/series/GFDEGDQ188S
- S042 — FRED / LBMA. “London Gold Price (GOLDAMGBD228NLBM).” Institutional data mirror. https://fred.stlouisfed.org/series/GOLDAMGBD228NLBM
- S043 — FRED / BIS. “Real Residential Property Prices (QUSR628BIS).” Institutional data mirror. https://fred.stlouisfed.org/series/QUSR628BIS
- S044 — FRED / BLS. “Rent CPI (CUSR0000SEHA).” Official data mirror. https://fred.stlouisfed.org/series/CUSR0000SEHA
- S045 — FRED / BLS. “Medical Care CPI (CPIMEDSL).” Official data mirror. https://fred.stlouisfed.org/series/CPIMEDSL
- S046 — FRED / BLS. “Tuition, School Fees, and Childcare CPI (CUSR0000SEEB).” Official data mirror. https://fred.stlouisfed.org/series/CUSR0000SEEB
- S047 — FRED / BLS. “Median Usual Weekly Real Earnings (LES1252881600Q).” Official data mirror. https://fred.stlouisfed.org/series/LES1252881600Q
- S048 — FRED / BLS. “Women’s Labor-Force Participation (LNS11300002).” Official data mirror. https://fred.stlouisfed.org/series/LNS11300002
- S049 — International Monetary Fund. “Silent Revolution, chapter 1.” Official institutional history. https://www.imf.org/external/pubs/ft/history/2001/chapter1.pdf
- S050 — WTF Happened in 1971?. “Viral chart collection.” Claim corpus. https://wtfhappenedin1971.com/
- S051 — Google Search Central. “Creating helpful, reliable, people-first content.” Official guidance. https://developers.google.com/search/docs/fundamentals/creating-helpful-content
- S052 — Google Search Central. “Article structured data.” Official guidance. https://developers.google.com/search/docs/appearance/structured-data/article
- S053 — Google Search Central. “General structured-data guidelines.” Official guidance. https://developers.google.com/search/docs/appearance/structured-data/sd-policies
- S054 — U.S. Bureau of Labor Statistics. “Productivity bulk data directory.” Primary data archive. https://download.bls.gov/pub/time.series/pr/
- S055 — U.S. Bureau of Labor Statistics. “CPI bulk data directory.” Primary data archive. https://download.bls.gov/pub/time.series/cu/
- S056 — Congressional Budget Office. “The Distribution of Household Income in 2021.” Official analysis. https://www.cbo.gov/publication/60341
- S057 — Federal Reserve History. “The Great Moderation.” Institutional history. https://www.federalreservehistory.org/essays/great-moderation
- S058 — Federal Reserve History. “Inflation topic portal.” Institutional history. https://www.federalreservehistory.org/topics/inflation
- S059 — Bureau of Justice Statistics. “National Prisoner Statistics.” Official data portal. https://bjs.ojp.gov/data-collection/national-prisoner-statistics-nps
- S060 — U.S. Census Bureau. “Income in the United States: 2024.” Official report. https://www.census.gov/library/publications/2025/demo/p60-286.html
Evidence control
Claims and sources are published separately
The package maps 45 recurring claims to a 60-source ledger and labels direct relationships, plausible contributions, mixed evidence, chronological coincidence, data limitations, and false premises separately.
Research reviewed: 26 August 2026. Breakpoint diagnostics are descriptive tests, not causal proof.